6. Visualization & Illustration Guide
PyEQSP provides powerful tools for visualizing partitions and point sets in both 2D and 3D.
6.1. Simple 2D Illustrations
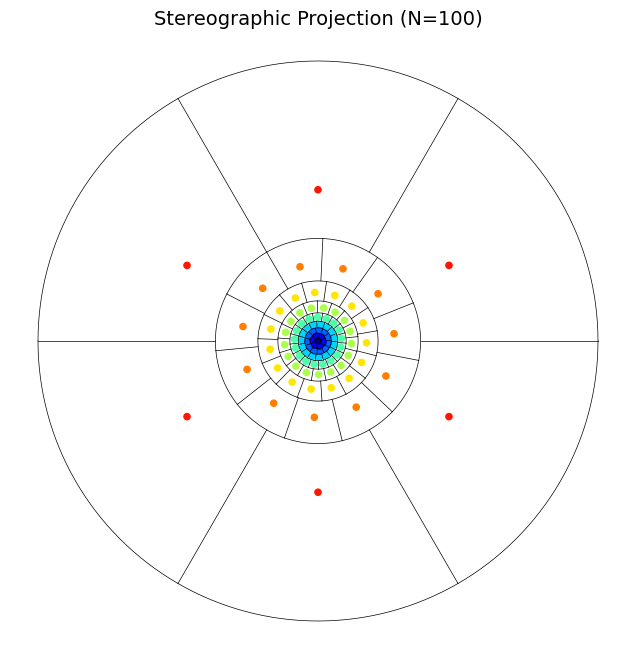
For quick analysis, 2D projections of the EQ algorithm are effective. The standard illustration shows how the sphere is partitioned into collars and regions.
6.1.1. Standard 2D Projection
The eqsp.illustrations module provides functions to visualize resulting partitions in common projections.
import matplotlib.pyplot as plt
from eqsp import illustrations

# Show a stereographic projection of 100 regions on S2
plt.figure(figsize=(8, 8))
illustrations.project_s2_partition(100, proj='stereo', show_points=True)
plt.show()
Tip
For a clean, executable version of this plot, see examples/user-guide/src/example_visualize_2d.py.
6.2. Interactive 3D Visualizations
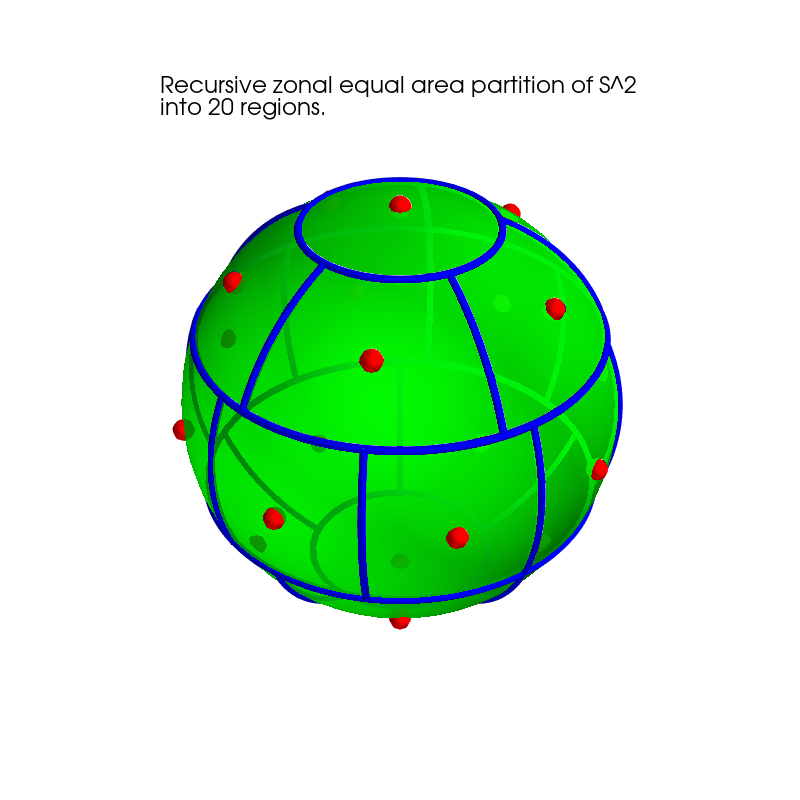
To truly understand the geometry of a partition or to inspect point sets on \(S^2\) and \(S^3\), PyEQSP leverages Mayavi for interactive 3D rendering.
6.2.1. Partitioned Spheres
You can rotate, zoom, and inspect the individual regions of a partition in 3D space.
from eqsp import visualizations

# Show a 3D partition of 100 regions with centre points
visualizations.show_s2_partition(100, show_points=True)
Tip
The interactive 3D script, including environment checks for Mayavi, is available at examples/user-guide/src/example_visualize_3d.py.
Note
Beta Feedback Wanted Visualization (especially 3D via Mayavi) is a primary focus of our Beta testing. If you encounter rendering issues, coordinate errors, or installation hurdles on your platform (macOS, Windows, or Linux), please let us know in the Feedback Hub.
6.3. Advanced Projections
For specific research or mapping needs, the library also supports advanced projections via eqsp.illustrations.project_s2_partition.
Mollweide: Equal-area projection of the entire sphere.
Lambert: Azimuthal equal-area projection.
Polar: For focusing on the North/South poles.
6.4. Jupyter Integration
PyEQSP is designed to work seamlessly in Jupyter Notebooks.
Inline Matplotlib: Use
%matplotlib inlinefor static plots.Interactive Widgets: Use
%matplotlib widgetfor interactive research. Mayavi can be configured viamlab.init_notebook().